How to Weight Data
Learn the 5-step process to correct sample probabilities and achieve representative survey results.
Do you want to experience our user-friendly tool for yourself?
Get your free trialWhat is Data Weighting?
Data weighting is a statistical technique that is used by market and survey researchers to correct survey data that is not representative of the population being surveyed. When your sample doesn't perfectly match your target population, weighting helps restore balance and reduce bias in your results.
Our tool makes this complex statistical process simple and accessible, allowing you to achieve professional-grade results in minutes rather than hours.
Watch: Data Weighting Explained

Data Weighting Tutorial
Mervyn Brookson walks you through the entire process in under 5 minutes
The 5-Step Data Weighting Process
View Sample Representation
Upload your data and immediately see how your sample compares to your target population across key demographic variables. Our tool automatically detects potential weighting variables and shows you the current distribution gaps.
Calculate Weight Factors
Set your target distributions and let our advanced algorithms calculate the optimal weight factors. The system uses proven statistical methods to determine how much each respondent should count in your final analysis.
Apply Data Weights
The calculated weights are automatically applied to each respondent in your dataset. You can iterate and adjust your weighting scheme as many times as needed without additional cost.
Match Population Proportions
Verify that your weighted sample now accurately matches your target population proportions. Our detailed reports show you exactly how well each variable aligns with your targets.
Produce Unbiased Results
Export your properly weighted data in your preferred format (CSV, SPSS, Excel) and proceed with confidence. Your analysis will now reflect the true population, not just your sample's quirks.
Visual Example: Male/Female Weighting
See how data weighting works in practice with this step-by-step visual example showing how to balance gender representation in your sample.
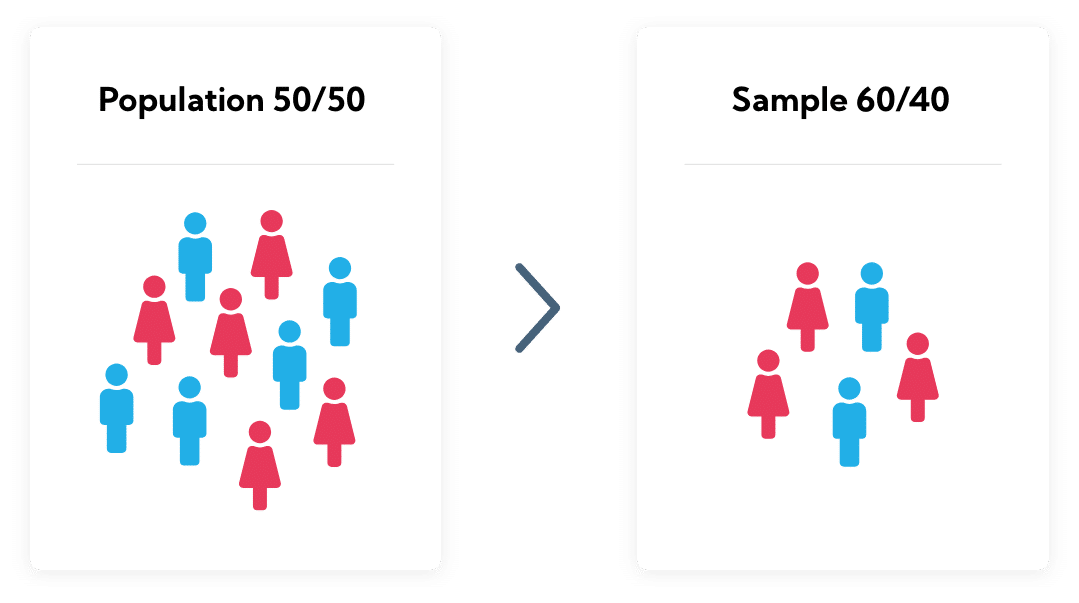
Representation of the sample
When you have a sample, you'll want to compare it with the population to see if all groups surveyed are proportionately represented according to their presence in the population. As you can see from our example, the blue group is underrepresented and the pink group is overrepresented. To get a proportionally balanced sample, you should weight the data.
Calculate the weight factors
If you want a sample that has the desired distribution according to the proportions in the population, you first need to calculate how much weight each group needs to be properly represented in the sample. For this, you can use a simple formula: % population / % sample = weight.
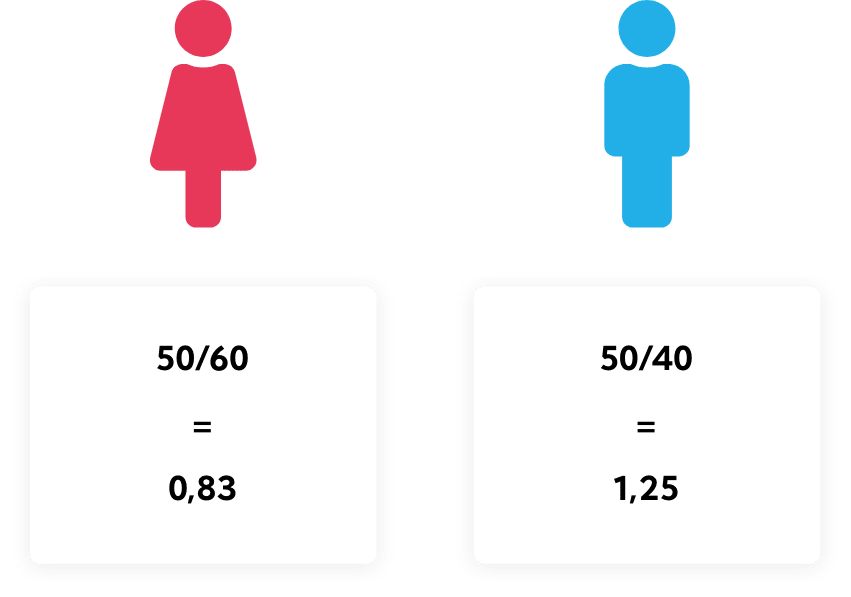
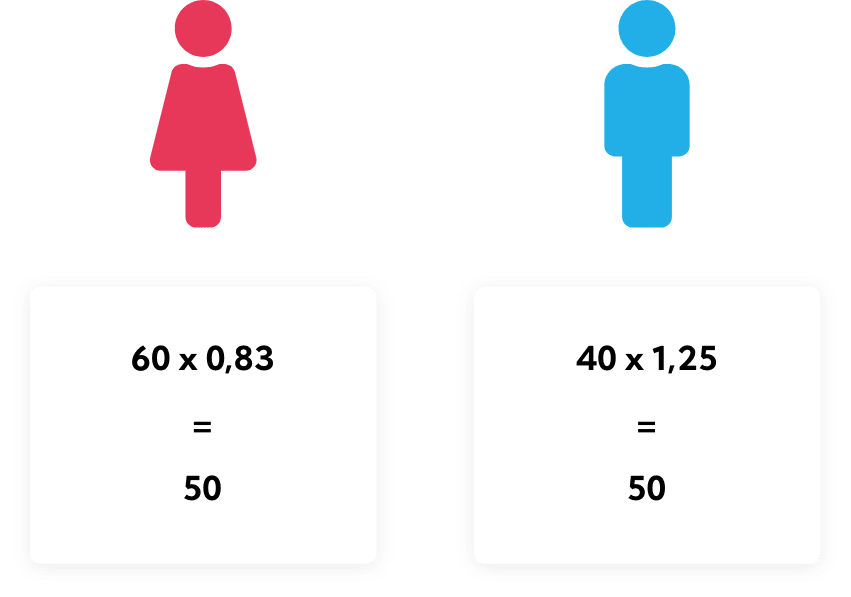
Apply data weights to sample proportions
Next, you multiply the sample data by the weights you've calculated in step two. Applying the weights will ensure that your sample proportions match those of the target population you've surveyed.
It's a match!
Now, when the population is compared to the weighted sample the proportions of respondents match.
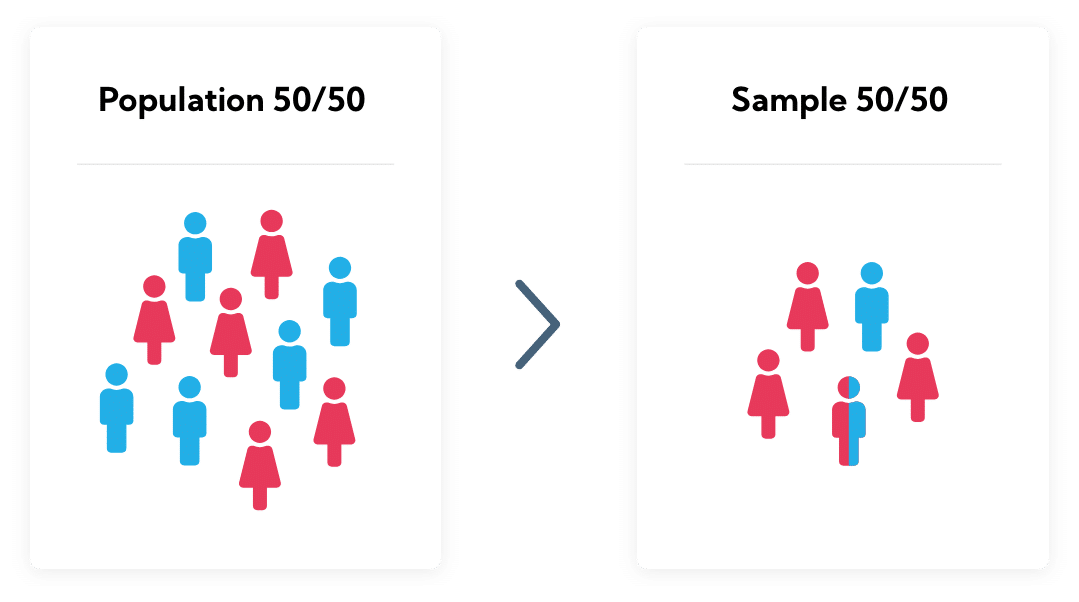
Made it easy
So far, so good. You might be wondering why you'd need a tool for this.
Now consider a situation where you have multiple variables besides gender that you want to control for, such as age, education level, and geographic region. The problem suddenly becomes complex. Imagine having to calculate weights for thousands of respondents by hand.
To solve this challenge, Sample Weighting created a web-based weighting tool enabling any researcher to easily calculate data weights for their sample, no matter how complex. There is no need to write syntax or have programming skills.
All you have to do is provide the data and set the targets.
Why Data Weighting Matters
Reduces Sample Bias
Corrects for over- or under-representation of key demographic groups in your sample.
Improves Accuracy
Makes your survey results more representative of the actual population you're studying.
Increases Confidence
Provides statistical justification for your findings and methodology.
Meets Standards
Follows industry best practices and research methodology requirements.
When Should You Weight Your Data?
Demographic Imbalances
Your sample has too many or too few people from certain age groups, genders, regions, or other key categories.
Response Bias
Certain groups are more likely to respond to your survey than others, skewing your results.
Quota Shortfalls
You couldn't meet your intended sample quotas for specific subgroups during data collection.
Population Changes
The population has shifted since your sample was designed, requiring adjustment to current demographics.
Get your free trial now!
With just a few clicks, you'll have access to our wonderful weighting tool. Let us make it easy for you.
Get your free trial
